Prepare the layers
Organize project areas, mineral claims, and sourced regional context for a clear web map.
Canterra Minerals’ interactive map brings its Newfoundland projects, mineral claims, and regional infrastructure into a shared geographic view, embedded directly in the company’s project pages.
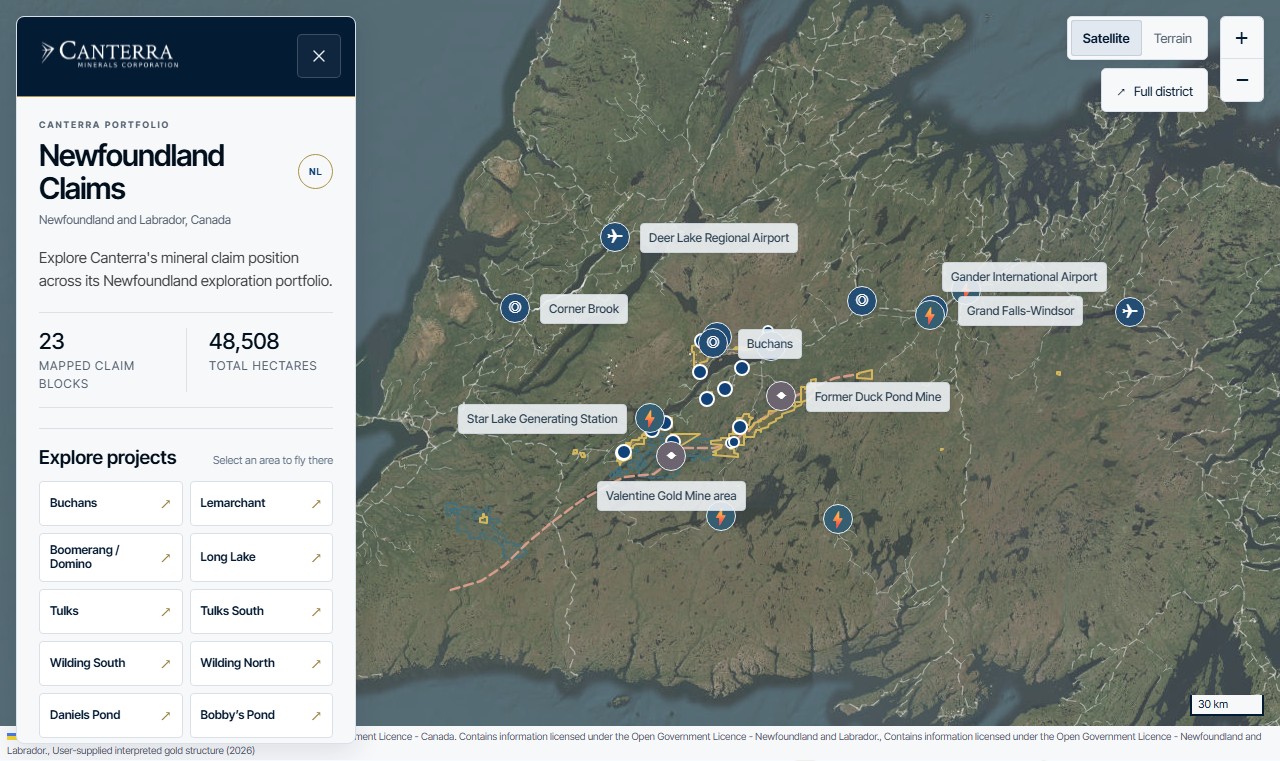
A district-scale exploration portfolio is difficult to communicate through a list of project names or a single static map. Visitors need to understand where the projects sit, how they relate to one another, and what infrastructure surrounds them.
The same map also needs to work across an overview page and individual project pages, with a useful opening extent and controls that remain practical on smaller screens.
A shared interactive map is embedded within Canterra’s project pages. The overview shows the wider Newfoundland portfolio, while individual pages open around the relevant project or group of projects.
Project navigation, satellite and terrain basemaps, switchable context layers, and infrastructure markers let visitors explore at their own pace. A full-district reset returns them to the wider view, and source credits remain available in the map.
Organize project areas, mineral claims, and sourced regional context for a clear web map.
Connect project selections, map extents, basemaps, and layer controls in one responsive interface.
Reuse the map across the portfolio overview and project pages with page-specific opening views.
Let visitors move between project detail and regional context without leaving the company website.
Canterra Minerals is the company featured in this live example. The screenshot was captured from its public projects page on October 6, 2026; map content may change. Basemap and data credits appear within the map. Open the live example to explore the current version.
A first conversation can establish whether the right answer is a cleaner workflow, a small script, a lightweight internal tool, or simply a better data structure.